Capacity Is the New Outage

Ali Kadhim
Co-Founder & CTO

Every team shipping AI features has had this conversation by now. Something is wrong in production, the traces are full of failed spans, and someone asks the only question that matters in the first five minutes: is it us, or is it them?
For most of the last decade the honest answer was usually "us." Infrastructure was boring and reliable, and when it wasn't, it failed loudly enough that you knew. That has changed. In 2026, a growing share of the time the answer is "them," and the failure doesn't look like an outage at all. It looks like a 429. Or a 529. Or a request that eventually succeeds after four seconds instead of four hundred milliseconds, long after the user gave up.
The infrastructure isn't down. It's full.
What actually fails in production AI
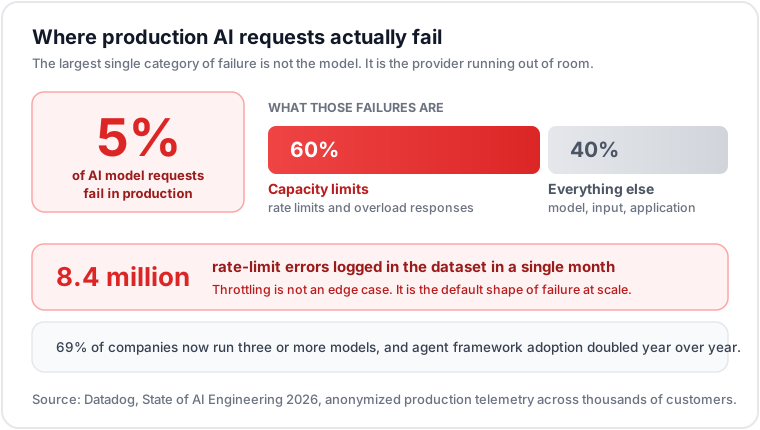
Datadog's State of AI Engineering 2026, drawn from anonymized production telemetry across thousands of customers:
- 5% of AI model requests fail in production
- Nearly 60% of those failures are capacity limits, not bugs, not bad inputs, not model errors
- In a single month, that dataset logged close to 8.4 million rate-limit errors
- 69% of companies now use three or more models, and agent framework adoption doubled year over year
The Dominant Failure Mode Is Capacity, Not Code
That 60% number deserves to sit for a second. The single largest category of production AI failure is not hallucination, not prompt injection, not a malformed tool call, not any of the things the industry spends its conferences on. It's the provider running out of room.
The structural reason is a timing mismatch that isn't going away. Demand for a model arrives the day it ships. A new frontier release pulls a wave of agentic workloads onto an endpoint within hours, and agents are not polite consumers: a single user action can fan out into dozens of calls with long contexts attached to each one. Capacity, meanwhile, is provisioned months ahead against a forecast, gated by GPU supply, power, and floor space. The gap between those two curves is where your 429 lives.
Meanwhile the load per request keeps climbing. In that same Datadog dataset, median token usage more than doubled year over year, and quadrupled for heavy users. Everyone is sending more tokens through the same ceilings.
July Was One Long Capacity Log
If you want to see this in the wild, the last month is a good place to look. OpenAI's public status history logged at least seven separate incidents in July, with July 22 alone carrying four entries. The specific language is what stands out. On July 16, users hit "Selected Model is at Capacity." On July 17, Codex 5.6-sol logged increased server-overload errors. On July 25, elevated error rates hit ChatGPT, the developer API, and Codex simultaneously, with reports from the US to India to Australia.
Then on July 29, Anthropic acknowledged elevated error rates across all models at 19:49 UTC, identified the issue at 20:33, and marked it resolved at 22:36. Users saw 529 Overloaded. The explanation was network failures that cut available capacity and forced traffic to reroute. Anthropic has previously attributed similar incidents directly to demand outpacing available compute.
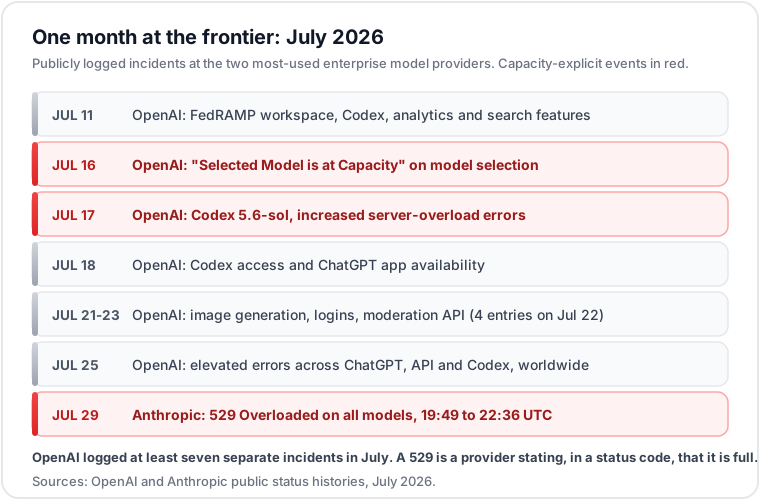
Read those as isolated bad days and you'll draw the wrong conclusion. Read them as a category and the pattern is obvious: the two most heavily used inference platforms in the enterprise both spent July intermittently running at their ceiling, and the errors they returned said so explicitly. A 529 is not an ambiguous signal. It is a provider telling you, in a documented status code, that it cannot absorb your traffic right now.
Your Retries Are Part of the Outage
Here is the part that stings, because this half is ours.
In March, Akamai surveyed 200 AI practitioners, three quarters of them infrastructure engineers, DevOps engineers, or solutions architects. The finding I keep coming back to: 51% of teams respond to slow inference by retrying the same model. Not failing over, not shedding load, not backing off. Retrying, into the same exhausted pool that just told them it was exhausted.
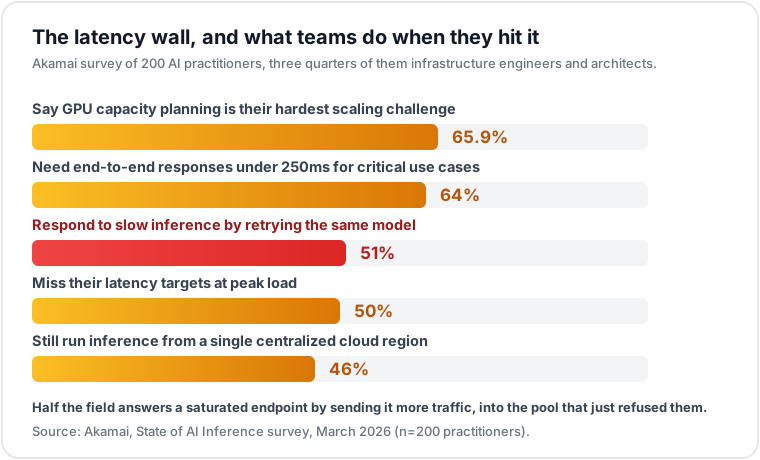
Do the arithmetic on what that produces. Suppose 10% of your requests start returning 429 and your client retries up to three times with a fixed delay. Offered load doesn't fall, it rises: you are now pushing up to 1.3x your normal request volume at the exact moment the provider is shedding traffic. Every retried request also re-sends its full input context, so your token consumption rises faster than your request count does. You are burning quota to generate failures. And because the retries are synchronized by the same triggering event, they arrive in waves rather than spread across the window, which is the textbook shape of a thundering herd.
The rest of the survey explains why this hurts so much. 64% of organizations need end-to-end responses under 250 milliseconds for critical use cases. 50% of deployments miss their latency targets at peak load. 46% are still running inference from a single centralized cloud region, and 65.9% name GPU capacity planning as their hardest scaling problem. The infrastructure is tight, the latency budgets are tighter, and the default client behavior when things get slow is to make them slower.
What To Instrument, and What To Change
Treating capacity as a first-class failure mode is mostly unglamorous engineering. Here's what I'd prioritize.
Account for tokens per minute separately from requests per minute. TPM is almost always the binding constraint in production, and it's the one most teams don't track. Anthropic splits it further into separate input and output pools, so a document-summarization workload and a long-form generation workload exhaust completely different ceilings on the same account. Counting requests tells you nothing about which one you're about to hit. Pre-count tokens before dispatch so you can shed or queue locally instead of discovering the limit at the provider.
Use retry budgets, not retry counts. A per-request retry count has no idea what the rest of the fleet is doing. A budget does: cap total retries at a fixed percentage of live request volume, say 10%, and once the budget is spent, fail fast. Pair it with exponential backoff and full jitter so recovering traffic doesn't re-synchronize into another wave. This one change converts a retry storm into a controlled degradation.
Trip circuit breakers on throttling, not just on 5xx. Most breaker configurations I see key on server errors and ignore 429 and 529 entirely, which means the breaker stays closed through precisely the failure mode that's most common. Throttle responses should open the circuit and route elsewhere.
Be careful with hedged requests. Sending a duplicate call when the first exceeds a latency threshold is a good tail-latency tool under normal conditions and an actively harmful one during a capacity event. Hedging into a throttled endpoint is a retry storm with better manners. Gate hedging on the same signal that trips your breaker.
Route across genuinely independent capacity pools. 69% of companies already use three or more models. Far fewer have wired them as failover paths with the prompt, tool schema, and evaluation work needed to make a switch safe under load. Independence matters more than count: a second model from the same provider in the same region shares the constraint you're trying to escape. 64% of Akamai's respondents called automated traffic steering critical, which tells you where the field knows it needs to go.
Checkpoint agent state. A mid-chain throttle that discards forty completed steps is a capacity error that becomes a cost error and then a correctness error, because the retried run re-executes side effects. Durable state between steps is what turns a provider hiccup into a resumable pause.
Move everything non-interactive to batch. Batch endpoints draw on separate quota pools and typically run around half the price. Every offline evaluation, backfill, and enrichment job you leave on the synchronous path is quota you're taking away from the requests a user is actually waiting on.
Track first-token latency and token throughput against a baseline, not just success rate. A request that succeeds in six seconds when it normally takes six hundred milliseconds is a failure in every way your users experience. Time to first token and p99 tokens per second are the metrics that see it. Success rate never will.
None of This Counts as Downtime
Now the part that connects back to why we're building what we're building.
Every managed AI service carrying these workloads publishes an availability SLA. Amazon Bedrock commits to 99.9% monthly uptime. Azure OpenAI publishes the same figure. Vertex AI is structured the same way. And a 429 breaches none of them, because throttling is not a failure under those contracts. It is documented, expected, correct behavior. The endpoint answered. It answered "no," but it answered.
So the largest category of production AI failure, the one accounting for nearly 60% of failed requests, sits entirely outside every SLA you have. The status page stays green. The uptime number lands above target. Your users watch a product that has quietly gone slow and stupid, your team burns an evening chasing a bug that was never in your code, and you pay full price for the tokens you spent on requests that returned nothing. This is the same structural gap I wrote about in July, except capacity is the sharpest version of it: the failure mode is now the most common one, the most expensive one, and the least contractually acknowledged one, all at the same time.
You cannot negotiate your way out of that on the contract you have today. What you can do is stop being blind to it. Measure throttled minutes as an availability event of your own, with your own thresholds and your own severity, independent of what the provider's dashboard says. Instrument 429 and 529 rates per model, per region, per account tier, and alert on them the way you'd alert on a 5xx spike. When the provider's status page and your telemetry disagree, your telemetry is describing your users' reality and the status page is describing the provider's.
At Next Signal we monitor AWS, Azure, and GCP continuously across hundreds of services, including the managed AI and GPU services now dominating enterprise bills, using independent signals that frequently surface degradation before a provider acknowledges it, and we automate the evidence trail so a real breach becomes a filed claim instead of a Slack thread nobody had time to finish.
The build-out will keep running behind demand for a while yet. Capacity ceilings are the shape that shortage takes when it reaches your application. The teams that come out of this well won't be the ones who found a provider that never throttles. They'll be the ones who assumed throttling was the normal operating condition and engineered for it, while everyone else kept retrying into a wall and calling it a mystery.
Curious what degraded provider performance is costing you? The ROI calculator at nextsignal.io gives you a rough estimate in under a minute.
Sources
Industry data and reporting cited in this article:
- Datadog: AI Is Hitting Operational Limits as Companies Rush to Scale (State of AI Engineering 2026)
- Datadog: State of AI Engineering
- BigDATAwire: Datadog Report, AI Is Hitting Operational Limits
- Akamai: AI Survey, 50% of Organizations Struggle to Maintain Latency at Scale
- Akamai: AI Inference Performance and Scaling Report
- BleepingComputer: Anthropic Confirms Claude Is Down Worldwide
- Cybersecurity News: Claude Worldwide Outage Disrupts Users With 529 Overloaded Message
- Anthropic Status History
- OraCore: OpenAI Status Shows a Busy July for ChatGPT and Codex
- Unite.ai: Global Outage Hits OpenAI's ChatGPT, API and Codex
- OpenAI Status History
- DevTk: AI API Rate Limits 2026, OpenAI, Anthropic and Gemini RPM, TPM and 429 Handling
- Amazon Bedrock Service Level Agreement
- Next Signal: Your Biggest Cloud Bill Has Your Weakest SLA